Frontline Winning %
Overview
While the standard Winning % module measures the effectiveness of a coach (Team Lead), Frontline Winning % shifts the analytical focus to the individual contributors (Frontline Reps). It measures the positive traction in metric performance driven by active coaching commitments at the frontline level.
Frontline Winning % provides a direct assessment of whether the performance of a specific representative is improving under the current coaching plan. The core mechanics of defining a "win" remain structurally identical: performance is measured from the start of the coaching commitment to its current state. If the commitment improves by the configured threshold, it is considered "winning". If progress is made but falls short of the threshold, it is "improving". If performance degrades, it is "declining".
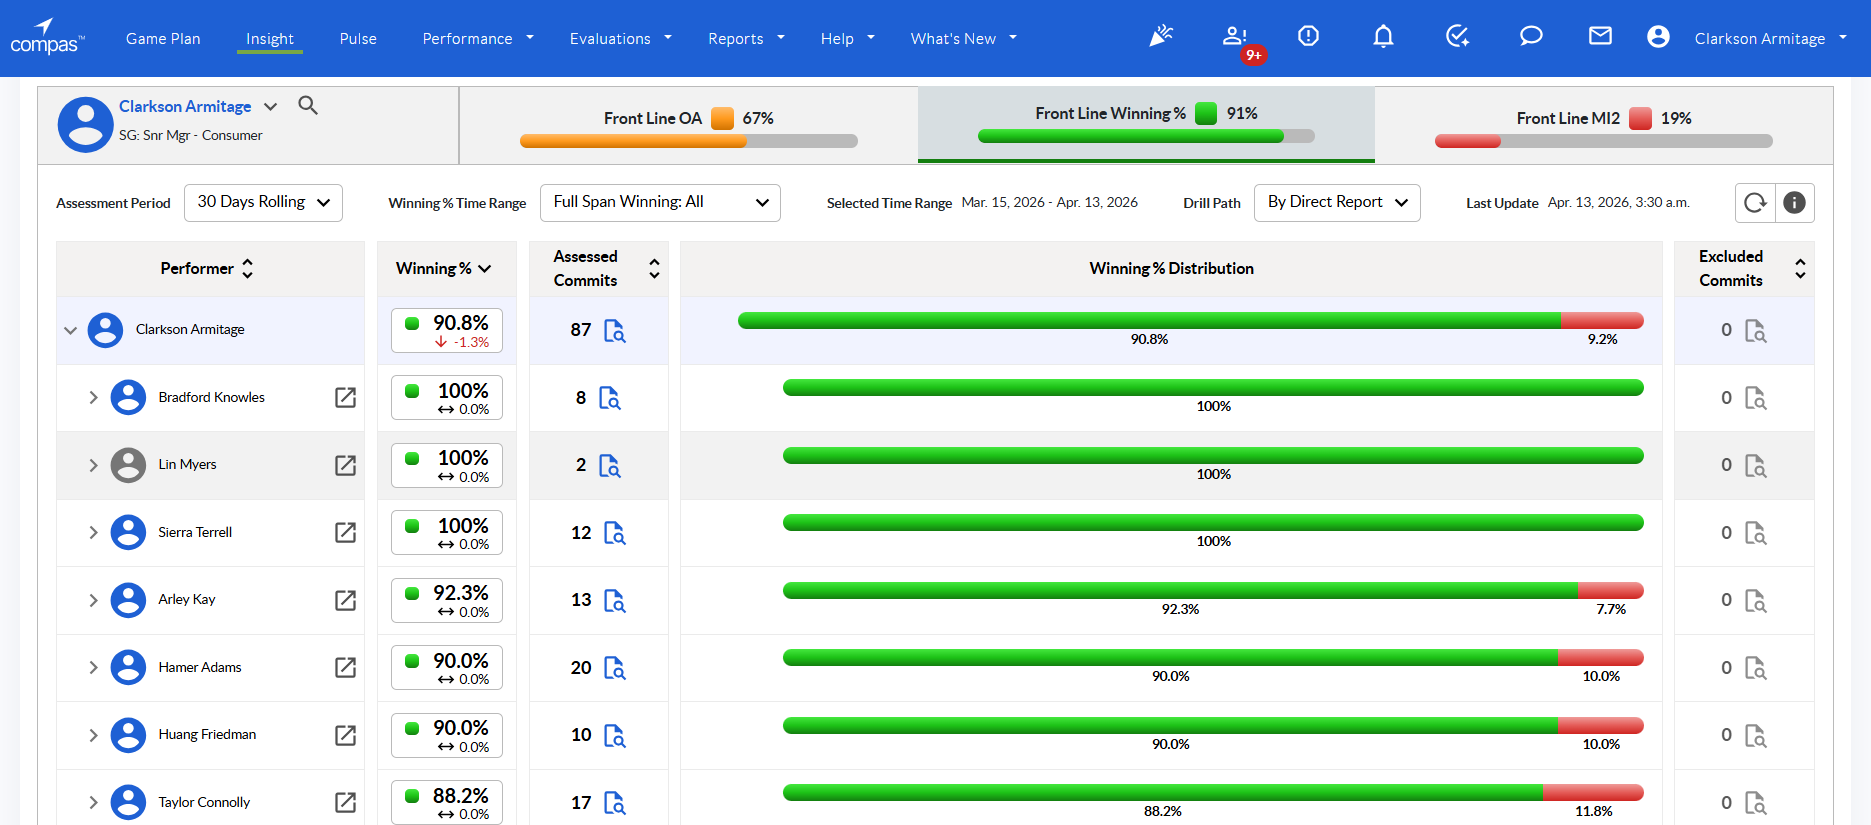
Figure 1: Frontline Winning % Dashboard
The module's global headers specifically isolate frontline performance:
- Frontline OA: The Opportunity Analysis score for the selected frontline group.
- Frontline Winning %: The overall winning percentage for the population. Hovering over this metric reveals a tooltip detailing the Period, Actual score, Target, and % to Target.
- Frontline MI2: The Metric Improvement Index isolated for the frontline population.
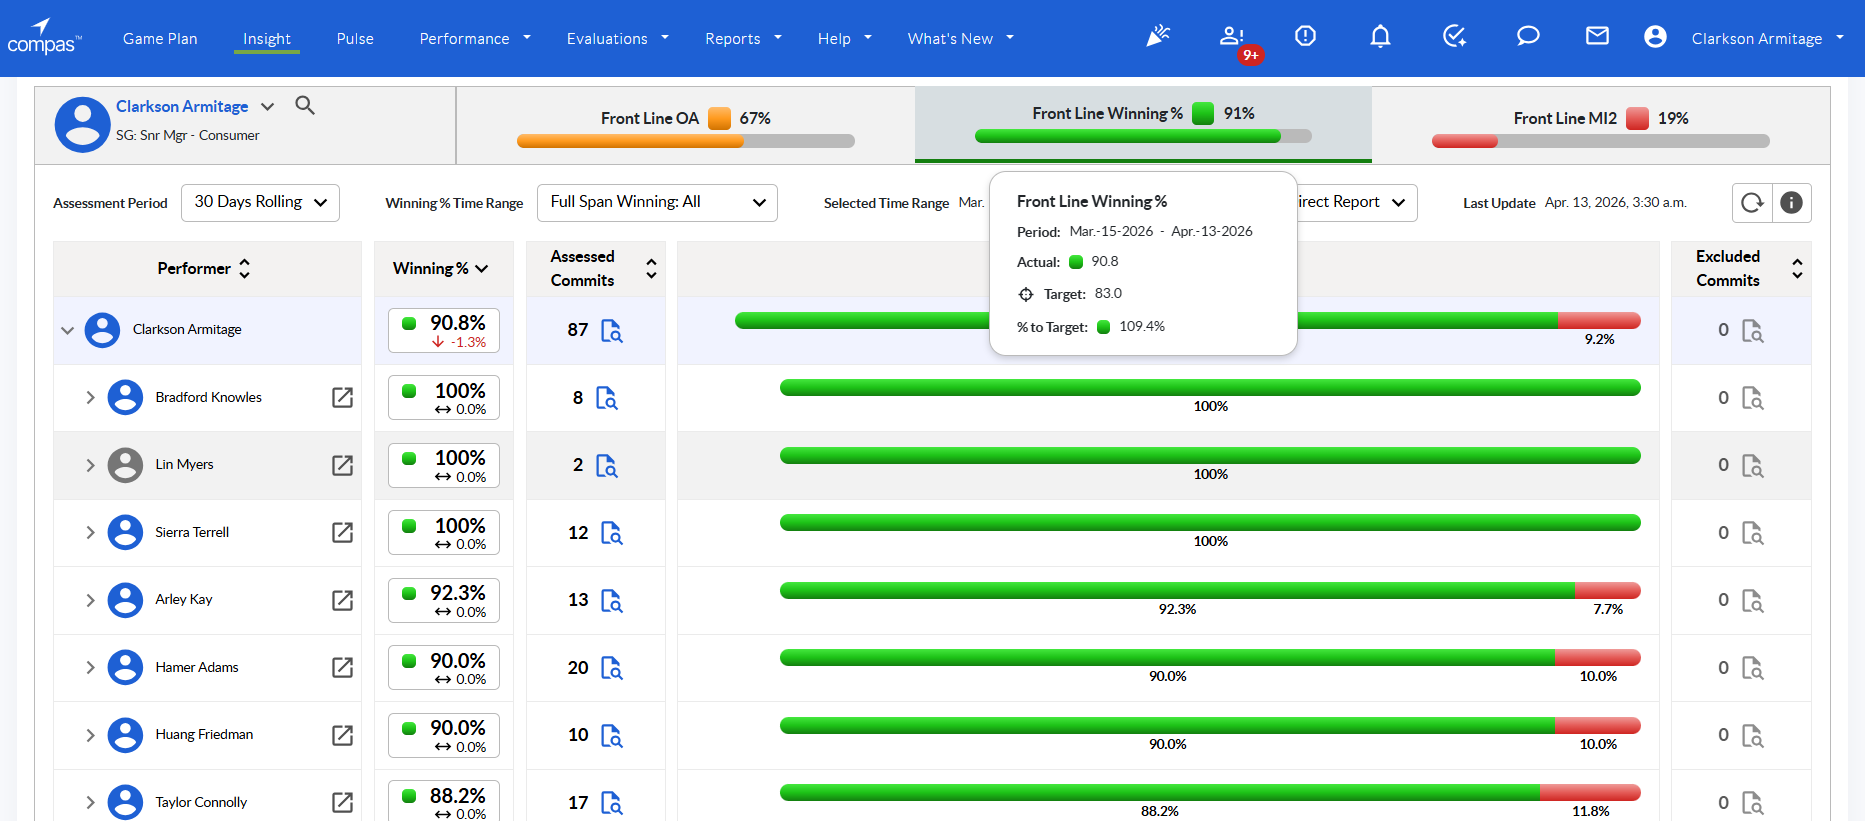
Figure 2: Frontline Winning Tooltip
Once a goal within a commitment is accepted and active for at least 7 days, COMPAS calculates the Start Value and Current Value to determine the percentage of improvement.
For higher the better metrics:
% of improvement = ((Current Value - Start Value)/Start Value) *100
For lower the better metrics:
% of improvement = (Start Value - Current Value)/Start Value) *100
Winning Threshold: The configured % improvement that a metric actual must achieve to be considered Winning. As soon as a KPI becomes favourable to target, it is considered winning regardless of the threshold.
- Winning: % of improvement >= Winning threshold
- Improving: % of improvement >= 0 AND % of improvement < Winning threshold
- Declining: % of improvement < 0
Winning % Calculation
The second column in the data grid represents the Frontline Winning % score for the specific row dimension (either by Performer or by Metric). The formula is:
Of Commitments Deemed Winning / Total Assessed Commitments *100
Column Elements:
- Threshold Square: Indicates if the performance is favourable to target (Green), close to target (Yellow), or unfavourable (Red) based on current actuals vs. configured target.
- Current Actual: The Frontline Winning % achieved for the selected period and time range.
- Trend Arrow: Indicates if the current performance has improved, declined, or stayed static compared to the previous period.
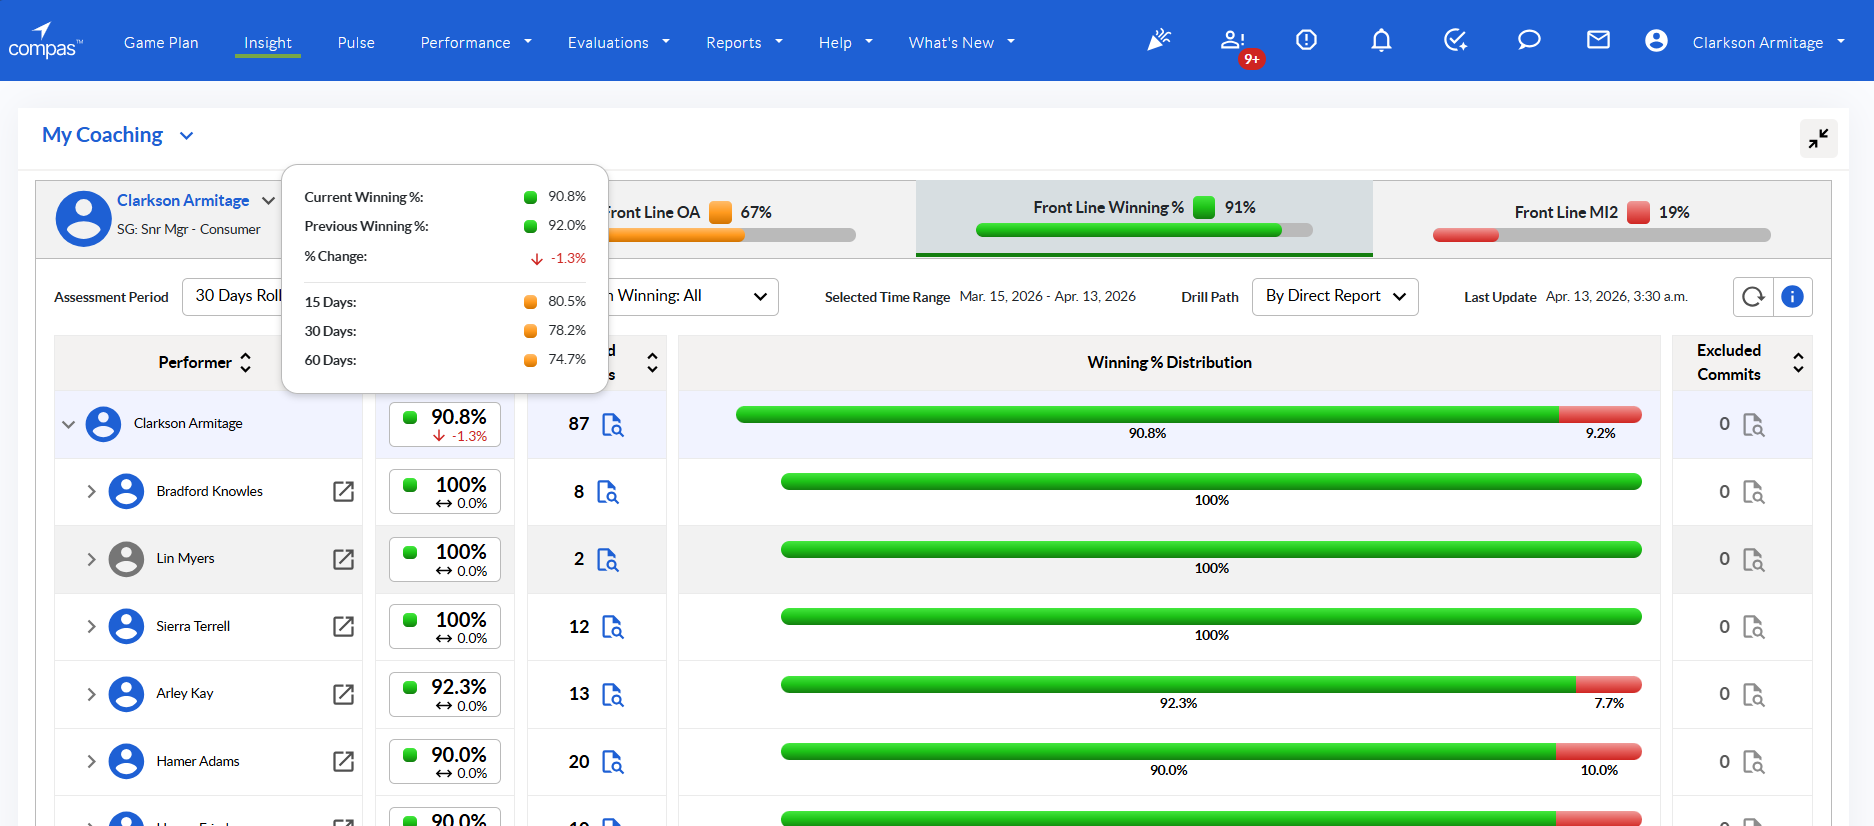
Figure 3: Winning Value Tooltip
Assessed Commits
"Assessed Commits" is the third column, representing the count of eligible frontline commitments included in the calculation. Each goal within a commitment is treated individually.
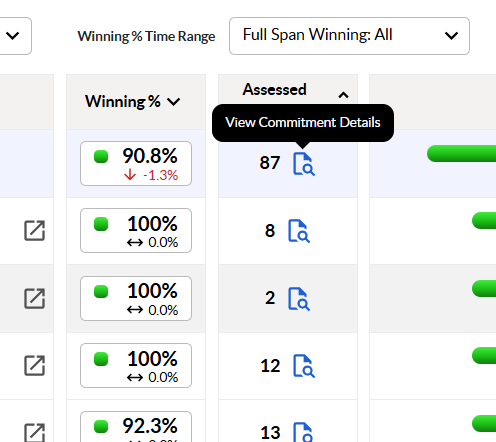
Figure 4: Commitment Details Button
Clicking the document icon opens a dialog box providing granular data on the assessed commitments. The pop-up grid elements include: Direct Report, Start Date, Days Active, Metric, Focus, State (Winning/Improving/Declining), Type, % Improvement, Winning Threshold, Start Value, Current Value, Wins At, and Status.
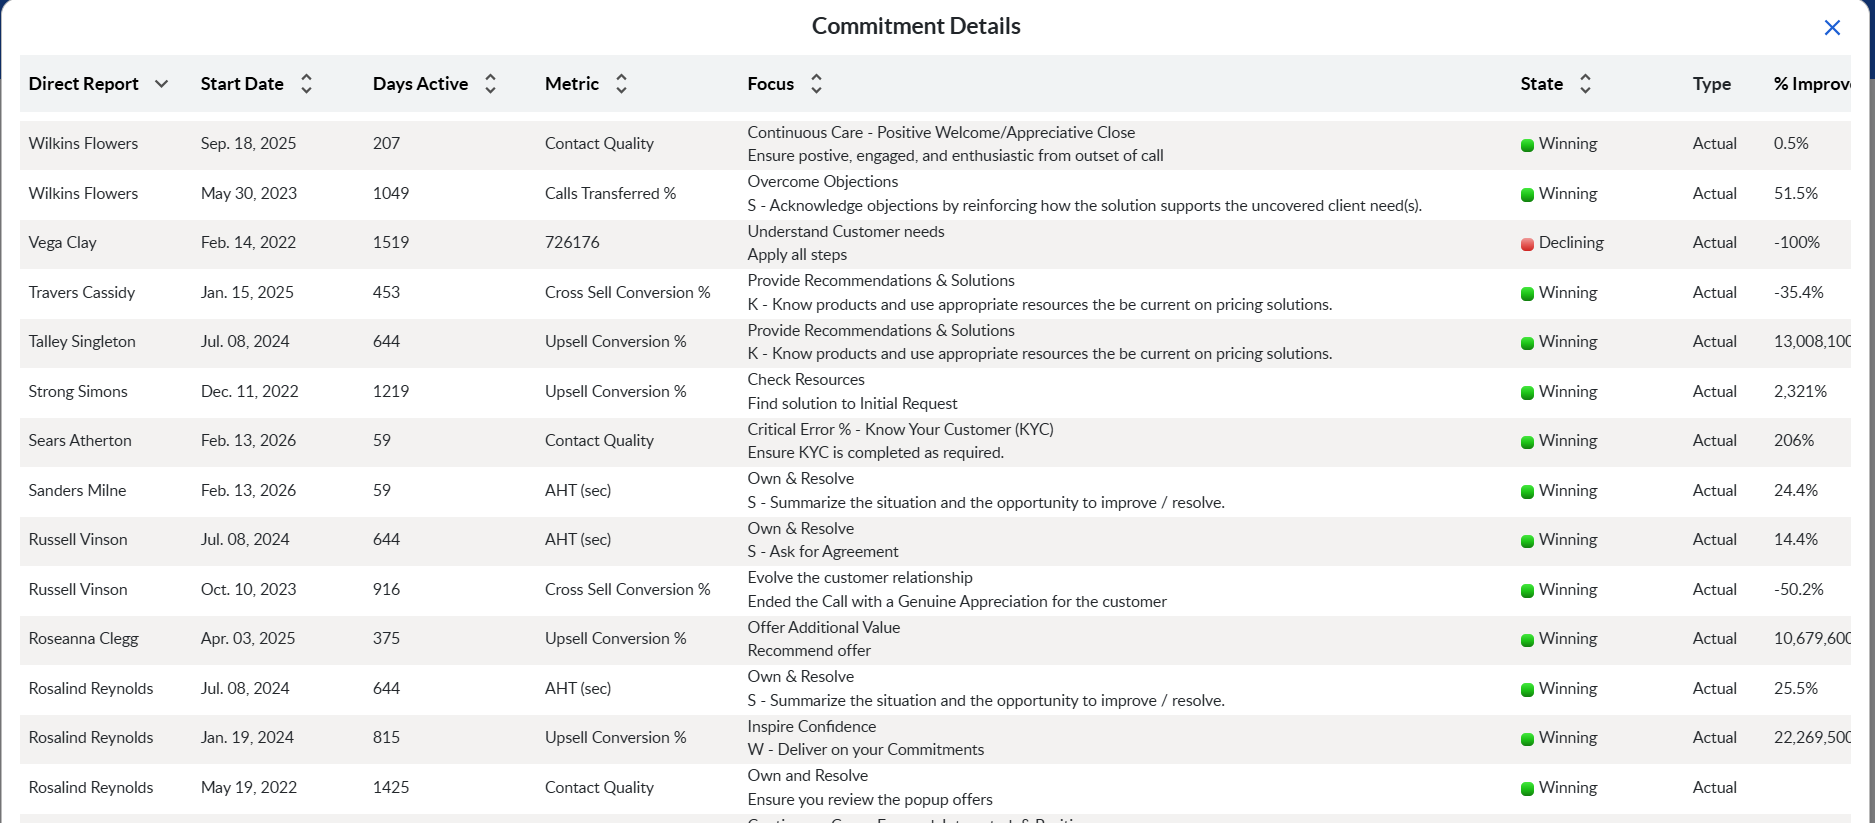
Figure 5: Commitment Details Pop-Up
Winning % Distribution
The "Winning % Distribution" column provides a visual horizontal bar chart demonstrating the volume distribution of commitments across the three states: Winning (Green), Improving (Gray), and Declining (Red).
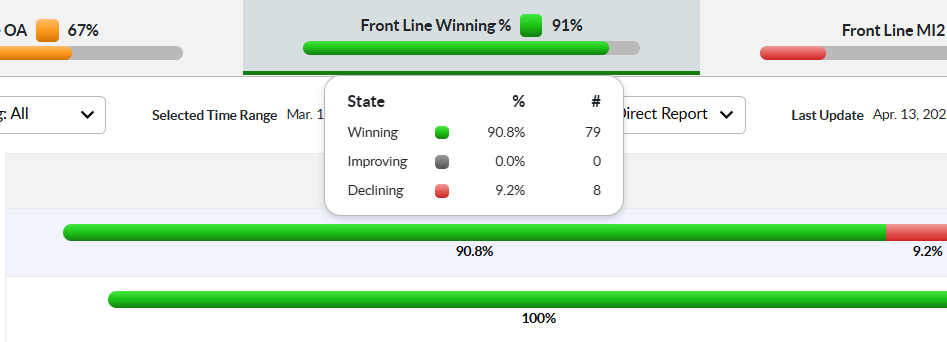
Figure 6: Distribution Tooltip
Team & Drill Path
The structural hierarchy of the Frontline Winning % module is controlled via user selection and the Drill Path dropdown.
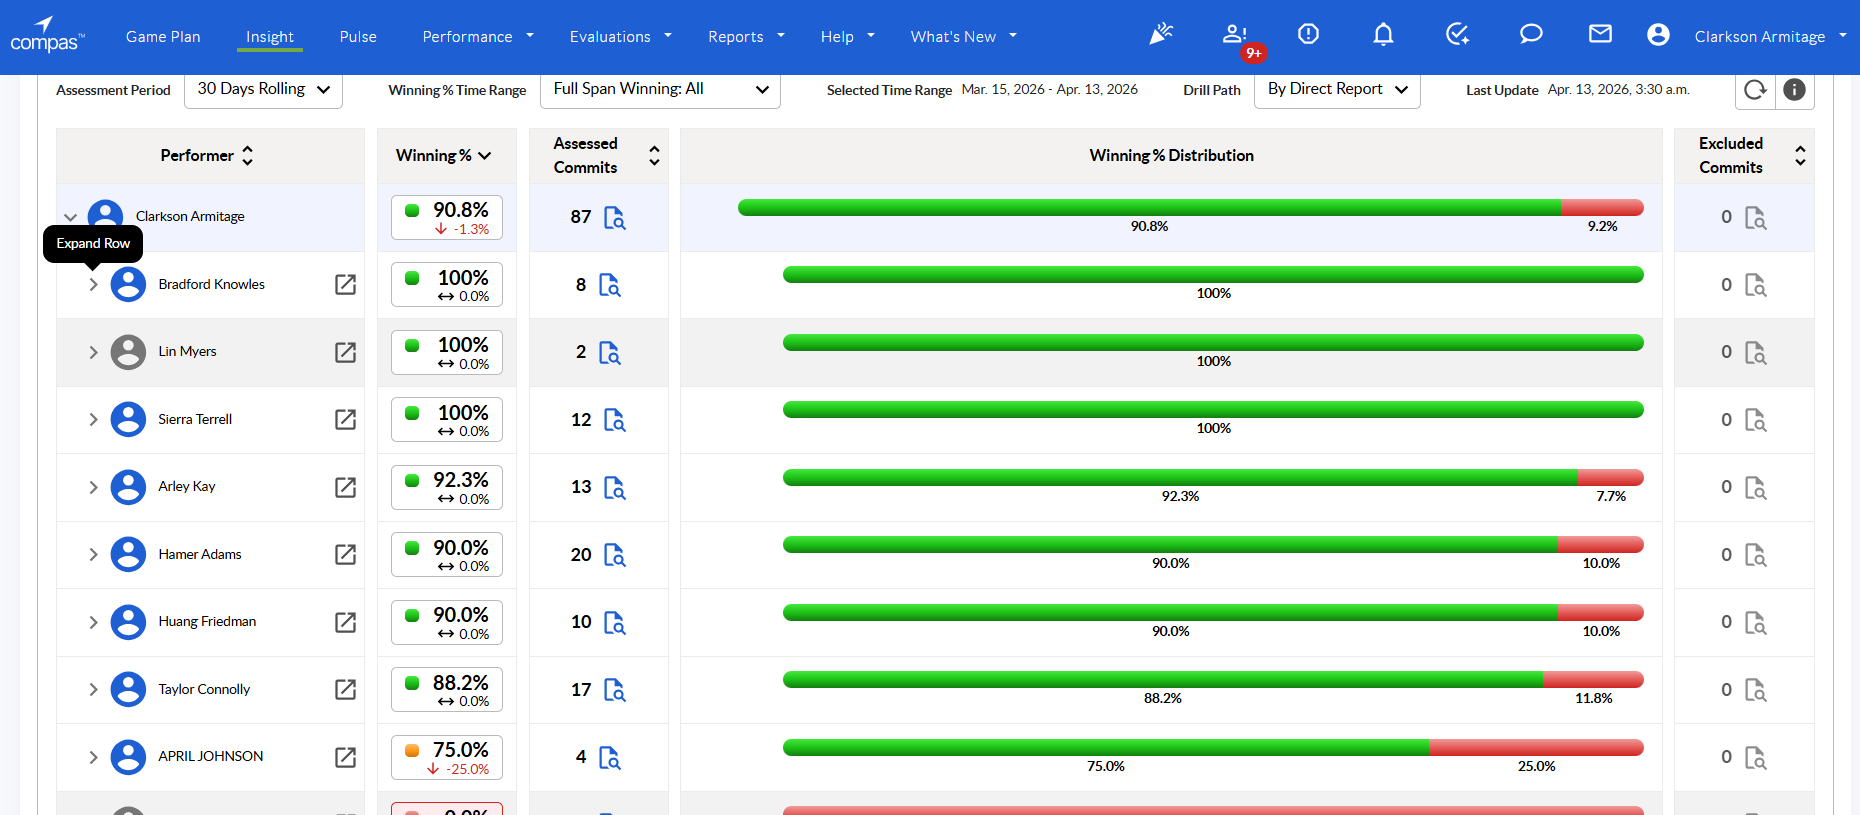
Figure 7: Expand Row
The available drill paths to slice the frontline data are:
- By Direct Report: Groups data by performer.
- By Metric: Groups data by KPI.
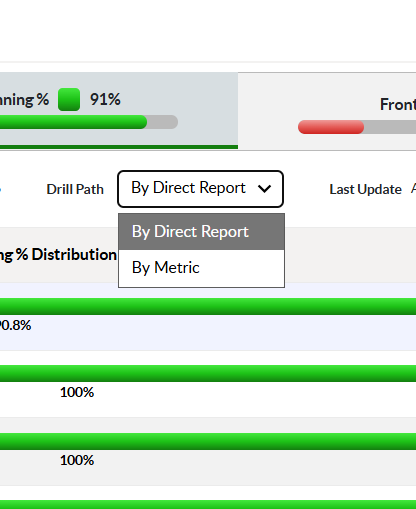
Figure 8: Drill Path Dropdown
Assessment Period and Time Range
The temporal parameters of the Frontline Winning % module are dictated by two dropdown controls: Assessment Period and Winning % Time Range.
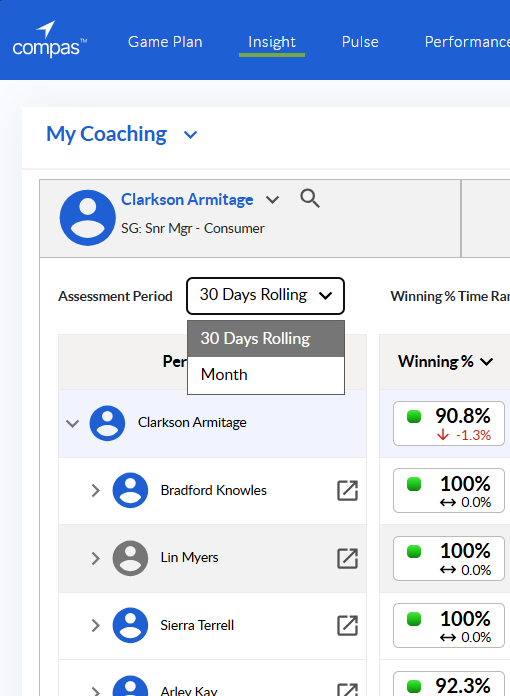
Figure 9: Assessment Period Dropdown
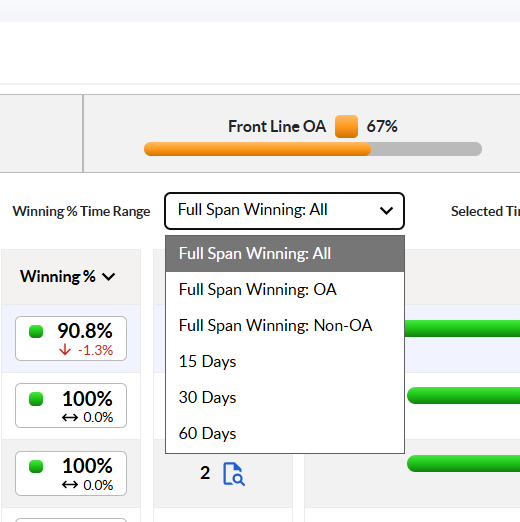
Figure 10: Time Range Dropdown
Module Controls
The module includes standard interface controls for managing the view.
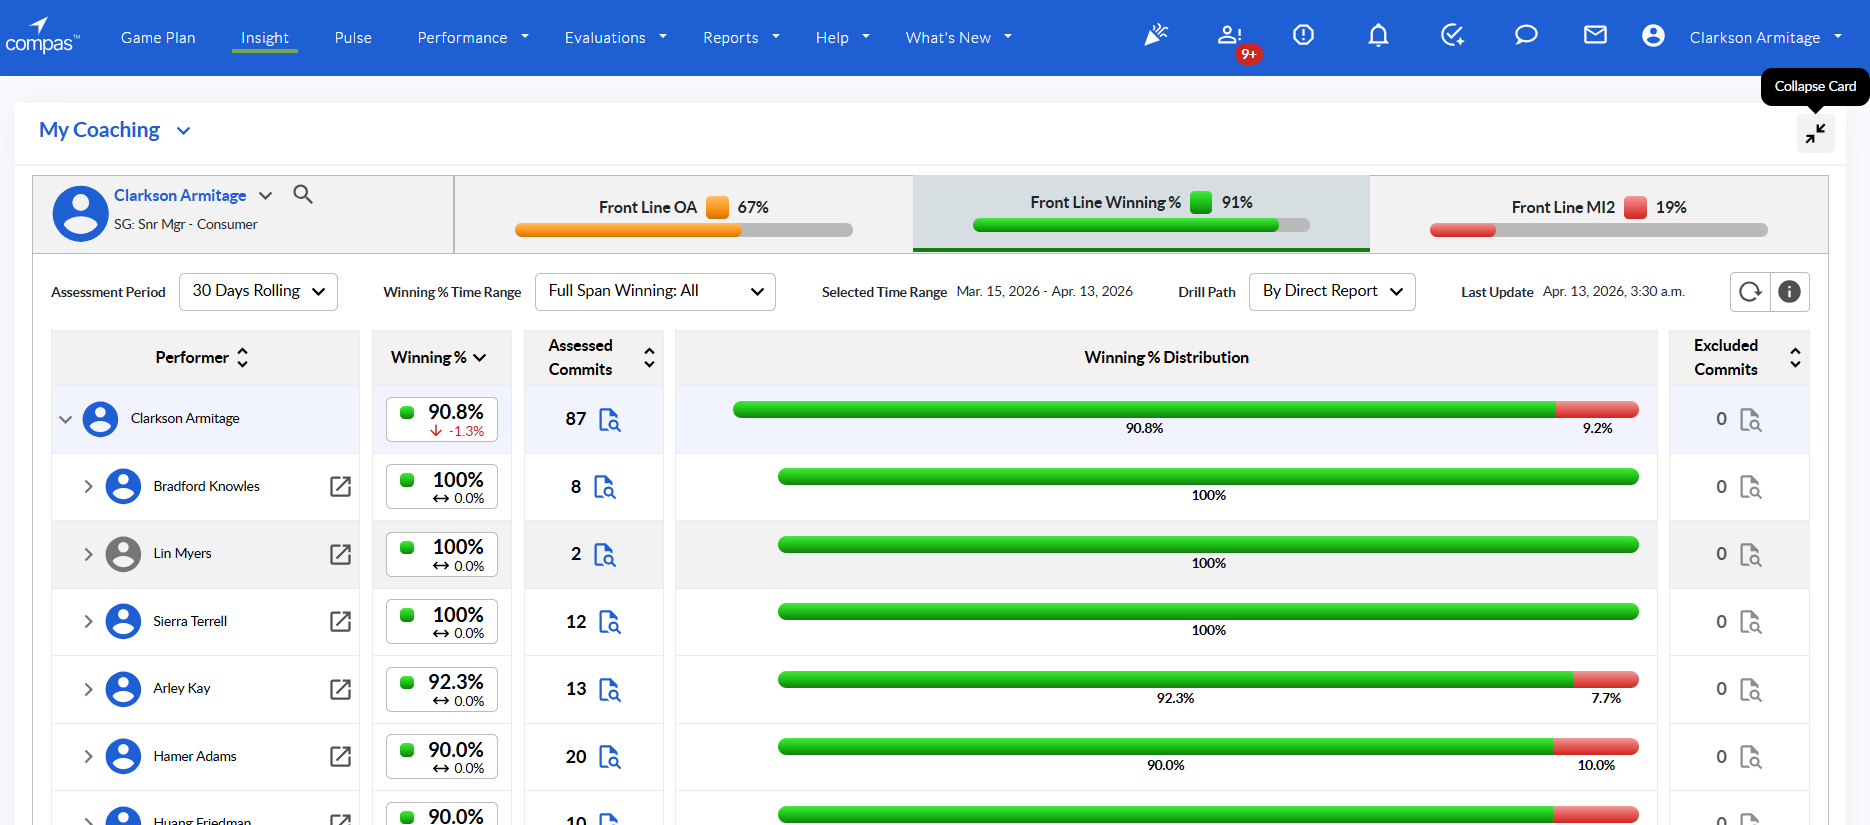
Figure 11: Collapse Card Button
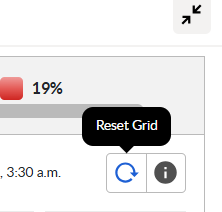
Figure 12: Reset Grid Button
Information
An information ("i") icon is located in the upper right quadrant of the module. Clicking this invokes the "Winning % Explanation" dialog.
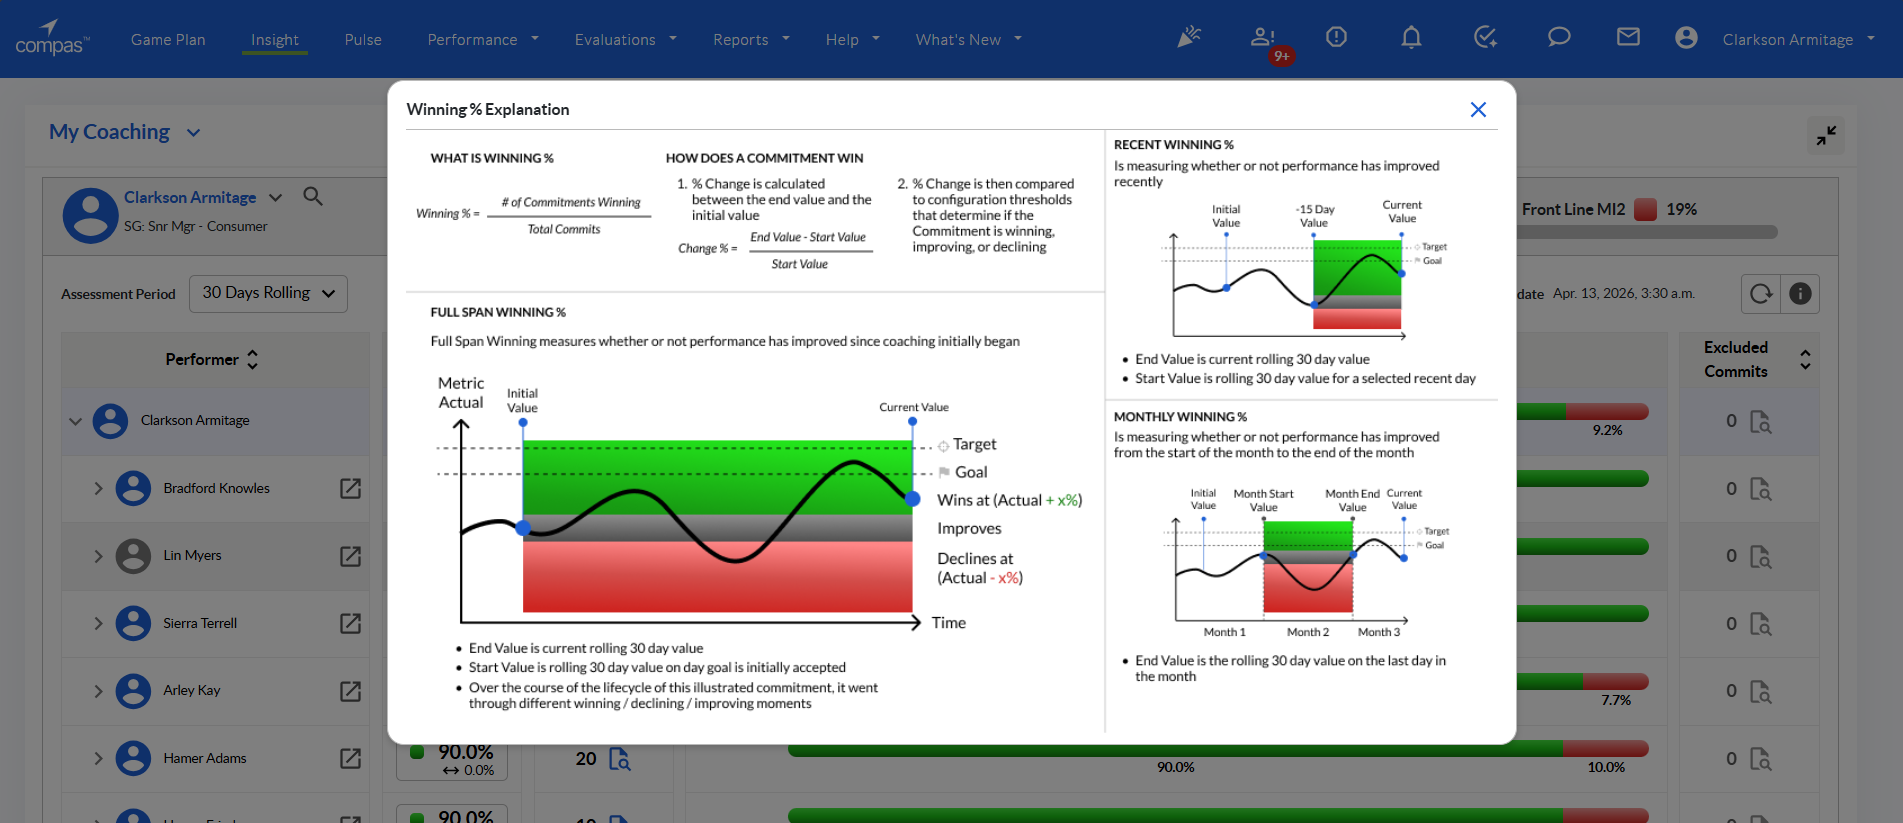
Figure 13: Winning % Explanation Dialog
Configuration & Permissions
Architectural settings like Winning Thresholds, Targets, and Calculation Types (Actual vs. % to Target) are managed at the organizational level via Change Request.
Access to this module is derived from the **Coaching Insight Module** permissions system. If you have permission to view a performer's coaching data, you will have visibility into their Frontline Winning % results.